This is not a new normal

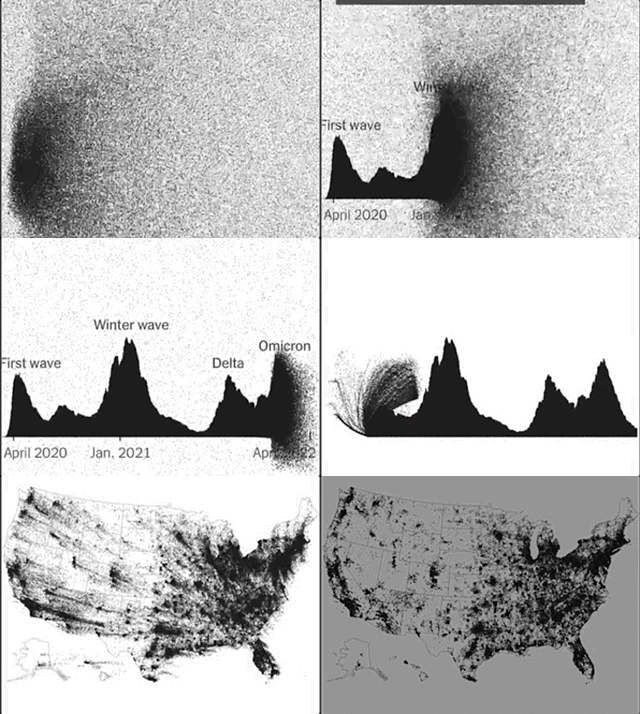
As for so many, the last few years have not been especially kind to us nor to our work. Usually we fill this segment with an inspirational nugget drawn from Black culture(s). But in this round we want to hold a recent data visualization from the NYT.

Paired with the experience's interactivity, the simple images continually aggregate, disaggregate, and morph– both a metaphor and a materiality for the complex ways we must continually process and experience painful information about the pandemic. You can click through to experience the graphic in its proper context. We're only offering an abbreviated version here: this is a lot to hold.
